
This is the second in our new SEO 101 series. A series intended to be of most use to those new to the search industry, or perhaps a useful refresher on some of the more fundamental elements of our day-to-day work and the services we provide to clients. In this post I wanted to look at a fundamental skill for any search professional, and that is good data analysis. In future posts we will be looking at more task-specific analysis, such as keyword research; however this post outlines a handful of principles you can extrapolate to any situation.
Firstly; (and to a certain extent this is personal preference), I would strongly urge that you do not rely on a single analytics package for your research and analysis. I’m not saying that you should invest in a bespoke tracking solution and compare that data against another; more that each web analytics provider has its own set of variables and ways of presenting data to you. When data is presented to us in a certain way, it is quite natural to allow that to steer us; however try not let your research and interpretation be limited by the functional interface. Personally, (though I love Google Analytics) if I’m doing a detailed piece of analysis, I prefer to export every single line of data available to me and collate into the same Excel spreadsheet and create a pivot table, so I can analyse any variable against any other.
Here are some tips, considerations and good-practises in data analysis for search.
1. Agree Your Data Variables and Performance Objectives with your Client
You’ve been engaged to provide a service or set of services to a client and maybe they have been extremely succinct and defined in their expectations of you. If not I would strongly recommend that you agree a set of reasonable expectations, and make it clear to your client the ways you will measure and report your performance against these objectives. I’m sure many established agencies have bespoke tools and resources to do this, but if not this is a really good exercise in proving your worth. We all know the fruits of our day to day efforts can take a long time to show up in the SERPS, and some actions can be quite intangible. Your client may not know that much of the growth in ‘referral traffic’ is a result of your link building for example. Make sure at the outset that your client is aware of how you will measure performance in what you are being paid for and how you will report that to them.
2. Never Present a Single Line of Data
Something I learned from Gianluca Carrera, a former commercial VP at Yahoo! now VP New Media at Truvo (and the person with the best analytical skills I have ever worked with,) is that a single line of data on a graph is an absolute waste of time. I know Analytics likes to present us with a single line graph and that is fine for a snap-shot; however presenting that data, or trying to interpret that data without comparator is not just meaningless, it’s impossible.
I know that Google do allow you to ‘compare to past’, which can be a useful illustration of (hopefully) growth, or seasonality, however some growth is outside our sphere of influence and some performance shifts cannot be understood simply by comparison to previous behaviour.
Additionally, it is important to note that a lot of our performance criteria in search, are not measurements in their own right, but often derivative variables of two or more original metrics. As an example if I am presenting Adwords CTR (click-through rate), which is a derivative normally expressed as a percentage, of ad impressions and number of clicks, I really need to present absolute impressions or absolute clicks (or both) against this data, to understand the interplay between the two original metrics.
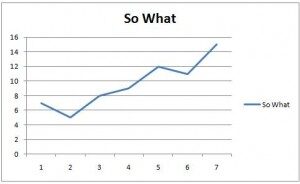
So What, Compared to Nothing
3. Don’t Self-Censor
I’m a big believer in trusting your gut. I think that ‘gut-feel’ or instinct (call it what you will) isn’t some sort of magic premonition, but rather a predisposition towards a particular theory, which is based on past experience. Now having said that, when it comes to data analysis, don’t let your gut-feel take you in the wrong direction. This is extremely pertinent when performing reactionary analysis, like when a performance issue occurs. I made a school-boy error myself quite recently when analysing the same performance issue on two sites belonging to the same client. I suspected the error on the second site was the same as the error on the first site. I exported the data, analysed the metrics and duly found the same indicators as before; however things didn’t improve… In a late-night lightning bolt moment, I realised that I’d ignored the golden rule. I’d self-censored by only exporting the data surrounding the issue I suspected. I immediately exported all of the site data and ‘lo and behold’ discovered that there was another instance of this particular issue further down the goal path.
Always start with a complete data pool, and though it makes sense to go first where your gut takes you, don’t self-censor.
4. Learn to Weight
Weighted algorithms are of course the stuff of our very existence. Knowing how to perform a weighted calculation is not just useful for testing our thoughts on ranking factor variables, but there are many practical applications on a much smaller scale. As this is a ‘101’ post I’m going to show a simple example of a weighted formula that can be used to get a deeper understanding of traffic performance.
In search we tend to be of an analytical mind-set and I’m sure by just a few days or weeks into a new client relationship, you will be able to recall the key stats regarding the site volume and conversion drivers. Another initial exercise I would recommend that you do as a matter of course is to establish a value understanding of each source of traffic by working out the weighted contribution of this source of traffic to two or more primary goals.
A common set of goals are to increase traffic, and drive sales. As an example, if 50% of traffic is from non-paid search and this traffic contributes 30% of conversions/completed goals; but then Facebook referral traffic at 20% of overall traffic drives 50% of conversions, this traffic is more than pulling its weight. It is in fact more valuable.
How Do I Define the ‘Value’?
i) Decide on your period of analysis and required data points.
As an example I’m going to imagine my client cares only about sales and volume, so I want a snap-shot picture of the value of each source of traffic where sales and volume are my metrics; for a single month.
ii) Identify your data.
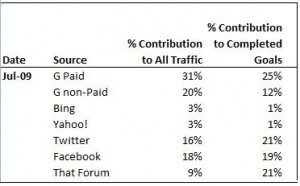
In my example you need each source of traffic, and its percentage contribution to total traffic and percentage contribution to total completed goals. In Analytics you will need to create a Custom Report to get this data together easily. If you haven’t explored Custom Reports, it is really straight-forward if a bit clumsy on the left-hand drag and drop.
iii) Export Your Data
Depending on how flexible your web analytics package you might need to do more than one export and copy/paste the data together. In my example we’d be aiming for something like this…
Any Similarity to Persons Living or Dead is Purely Coincidental
iv) Assign a ‘Weight’
In speaking and consulting with your client, they may tell you that they have a dual objective for both volume and sales growth, in which case both elements of the calculation could count for 50% of the calculation. In my example, I’m going to imagine that my client prioritises total sales a bit more than volume growth, so I’m going to say that volume contribution of each traffic source counts for 40% of my calculation and contribution to sales counts for 60%
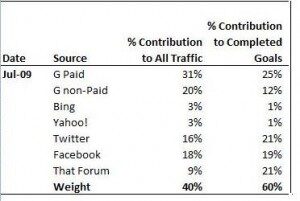
Arbitrary Weight Assigned
v) Insert Your Formula
Unfortunately there is no Function for a weighted average, but you can enter the formula as follows…
=SUMPRODUCT(VALUES,WEIGHTS)/SUM(WEIGHTS)
In my sheet this would look like this…
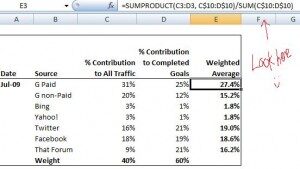
Formula 1
(The ‘$’ symbol before the row number tells excel to fix the reference to that particular cell, so that when I ‘fill-forward’, other rows update, but the reference to the cells containing the weight stay fixed. I bet you already know this, but no harm in over-stating in a ’101′ I hope.)
What we have here is a weighted average calculation, used as a representation of the value of each source of traffic, expressed as a percentage. What such an exercise will tell us is that, though focusing on volume may be a natural way to prioritise, we may find that it could be more valuable to start elsewhere, or move a particular activity higher up the agenda. In my example it would make a lot of sense to focus on link-building with sources akin to “That Forum” and upping activity levels on Twitter and Facebook.
Of course, a formula is a formula and once you are comfortable using this, you can extrapolate these principles to any situation, according to the relevent priorities. If you have any questions about data analysis on any level just @NicholaStott and I’ll be happy to see if I can help. If I can’t, I do know someone who can!